The reality of running an organisation is that human capital management is inevitable, and it can be complicated. From the recruitment process and recruiting costs to learning and development and employee productivity, you need to ensure the efficiency of your workforce.
This is where human resource metrics come in. These key HR metrics prove the effectiveness of HR activities in your organisation, providing valuable insight into areas that might need additional optimisation to ensure your workforce works smoothly and productively.
What are HR metrics?
HR metrics, or human resource metrics, are measurements used by organisations and their HR professionals to track the value and efficacy of their human resources initiatives. Because your essential HR metrics are tied to business strategy, in that they show how HR contributes to the organisation, they’re crucial for HR teams that want to develop a data-driven HR management strategy.
The importance of HR metrics
Don’t confuse HR metrics with HR analytics. HR metrics collect data on the performance, efficiency, and efficacy of your business, business processes, and workforce. HR analytics look at the same key data points, but go into more depth to evaluate how best to affect organisational improvement.
But don’t think that HR metrics are less essential just because they don’t go into as much depth. While they don’t offer much on their own, you can start to see patterns and trends that can inform how the business should forge ahead when they’re paired together.
Whatever you define as your important HR metrics should have several purposes, like:
- Making data-driven decisions
- Evaluating the value of human capital
- Measuring the efficiency and effectiveness of HR initiatives.
This can’t be done by measuring these metrics once. Understanding HR metrics is a continuous process that must be repeated regularly to track trends, patterns, and the efficacy of previous improvement initiatives. By tracking HR metrics over time and using them in combination with other business or L&D metrics, you’ll paint a clearer picture of what’s working for your organisation and what isn’t in terms of optimising employee performance.
Identify areas for improvement
The right metrics can reveal aspects of your organisation or HR initiatives that aren’t correctly optimised, leading to lowered employee performance and revenue, and increased employee absences. For example, if your voluntary turnover rate is high, that could indicate poor employee engagement, or little internal mobility within the organisation, among other potential causes. Essentially, it’s about finding inefficiencies to address.
But what are inefficiencies? When it comes to your essential HR metrics, it’s referring to businesses not utilising their employees correctly, either by denying them the correct resources to perform their jobs, under-developing their job-specific capabilities, or spending a disproportionate amount on labour costs compared to the size and performance of your business. These inefficiencies result in lost productivity, employee satisfaction and revenue.
Improve decision-making
Objective HR data will reveal which areas of your business need optimisation and how well your previous improvement efforts in HR processes have worked. This can be used to prioritise which areas need to be reviewed and optimised first, and helps your HR team in creating and implementing a comprehensive people strategy.
Benchmark against industry standards
You’ll be able to see how well your organisation performs in relation to competitors within the industry. If your metrics indicate that you’re falling behind and failing to meet goals that competitors are consistently meeting, it could indicate that you need to optimise your company’s workforce.
For example, if competitors in your industry consistently generate a greater average revenue per employee than you do, it could mean your workforce needs training, or that you don’t have high enough employee satisfaction to maintain performance targets.
Demonstrate HR value
You want to prove the value of your HR department and the impact it brings to the business. By tracking HR metrics, you can see where human resource management has succeeded in implementing effective initiatives that improve employee retention, engagement, hiring processes and labour costs. This enables HR departments to prove their value to the business, business leaders and stakeholders.
The 10 key HR metrics
Your key HR metrics are the ones that reveal the health of your organisation, its workforce, and its efficiencies. These are the metrics that matter most to your business leaders and stakeholders. While these metrics don’t tell you much in isolation, the overall patterns and trends they reveal over time help to improve workforce planning efforts and introduce incremental change in the workplace that increases the key performance indicators for the business.
With that in mind, it’s essential that you actually convey the context for your metrics and their results to your stakeholders and business leaders. Most people outside of HR departments won’t understand the technical jargon, so you need to communicate how each metric feeds into your organisation’s business goals and strategy. This is important if you want them to buy-in on human capital management efforts—especially because improvement efforts have long and ongoing targets to reach.
We look at the ten most common metrics for organisations to understand the efficacy of their HR initiatives.
- Employee turnover rate
- Voluntary turnover rate
- Involuntary turnover rate
- Revenue per full-time employee
- Profit per employee
- Labour to revenue ratio
- Absence rate
- Cost of absenteeism
- HR to employee ratio
- Promotion rate.
Employee turnover rate
Employee turnover, or turnover rate of talent, describes the rate at which employees leave an organisation over a period of time. Turnover can be both voluntary and involuntary—that is, whether talent left the organisation of their own choice or because of their employer’s decision. It’s a metric used to identify and evaluate underlying issues and areas for improvement in talent management, recruitment efforts and employee retention.
Turnover is an inevitable occurrence as talent naturally moves in search of new opportunities, retirement, or other reasons. In this way, some employee turnover is necessary and even considered healthy. Gallup suggests that a healthy turnover rate is around 10%, but that can vary from industry to industry. What’s more important is understanding why turnover occurs.
For example: Turnover can be functional or dysfunctional, regardless of whether it’s voluntary or involuntary.
- Functional voluntary turnover occurs when employees identify themselves as unable to meet the standards and expectations of the company, and thus, choose to leave.
- Functional involuntary turnover is when a company identifies and terminates or reassigns employees who aren’t performing as well as they should be.
In other words, functional turnover is about poor performers leaving your organisation, and creating a more efficient—and functional—workforce.
On the other hand, dysfunctional turnover occurs when your top performers leave your business at a higher rate than poor performers. This kind of turnover is considered dysfunctional because of the impact it has on your capital due to a loss of productivity and capability and talent shortages.
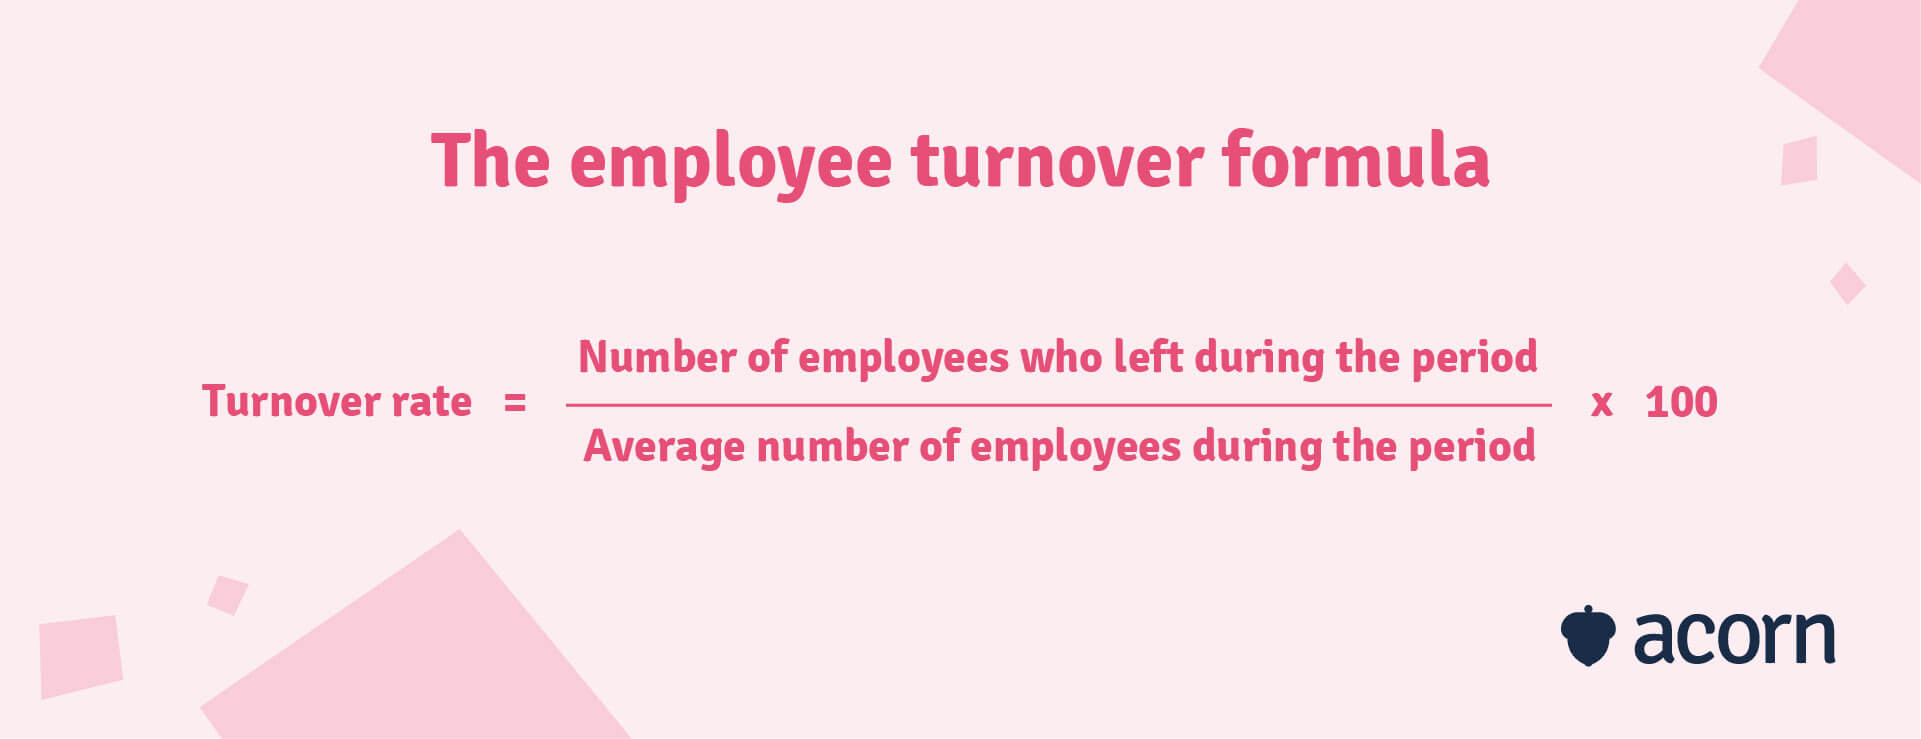
You can calculate your employee turnover rate by dividing the total number of employees who left during a given time period by the total number of employees during that time, multiplied by 100.
Voluntary turnover rate
Voluntary employee turnover is a specific type of employee turnover referring to the occurrence of employees leaving an organisation over a certain time period based on their own choice rather than that of the business. It occurs naturally as employees willingly leave to seek out new opportunities, making way for new talent and organisational change. Voluntary turnover isn’t the same as attrition, which encompasses all long-term vacancies and position removals.
Voluntary turnover can occur because of any number of internal reasons (factors relating to the employee’s job, team, or the organisation itself) or external reasons (factors from outside of the job, including personal reasons). Reasons influencing an employee’s choice to leave an organisation include:
- Family responsibilities
- Relocation
- Health issues
- Lack of flexible working hours
- Poor work-life balance
- Job dissatisfaction
- Company culture
- Retirement.
Calculating voluntary turnover can be done by dividing the number of employees who voluntarily left the organisation by the average number of employees during the same period, multiplied by 100.
Involuntary turnover rate
Involuntary turnover is the opposite of voluntary turnover. This metric measures the percentage of employees who leave an organisation involuntarily—that is, for reasons outside of their control. In other words, it’s the company’s decision to end employment, usually for reasons that make a staff member’s continued employment with the organisation untenable.
Those reasons don’t necessarily have to be the fault of the employee, either. They can also be extenuating circumstances that force a business to make the hard decision to sever employment. Reasons for involuntary turnover include:
- Poor performance. Employees who continually fail to meet set performance standards and expectations can be terminated as a result.
- Misconduct. Unsatisfactory behaviour can include violating codes of conduct, breaching company policy, harassment, engaging in unethical behaviour or even non-compliance with legal regulations.
- Organisational restructuring. Downsizing the workforce, mergers, and acquisitions can cause some job roles to become redundant as businesses redefine the capabilities and positions required to achieve their strategy.
- Cost-cutting. Difficult economic conditions can prompt slower or halted talent acquisition, leading to layoffs and terminations.
- Incompatibility. Sometimes employees aren’t a good fit in a company’s culture, creating friction and even toxicity in the workplace, necessitating their termination.
You can calculate your involuntary turnover rate by dividing the number of employees who left your organisation involuntarily by the total employees you had over that period of time, multiplied by 100.
Revenue per full-time employee
Revenue per full-time equivalent (FTE), or revenue per employee (RPE), is an HR metric used to measure how much revenue your full-time employees (or the equivalent of full-time employees) generate for your organisation. The idea is to provide insight into how effective a business’s workforce is in terms of productivity and performance.
The higher your revenue per FTE, the more each employee contributes to the company’s bottom line. On the other hand, a low employee revenue ratio might indicate that a company isn’t utilising its workforce effectively.
Your revenue per FTE is influenced by a number of factors:
- Industry. Different industries have different employee revenue ratio standards.
- Company age. Younger organisations tend to have lower revenue and profit margins than established companies.
- Company size. Smaller companies may have fewer resources available to employees to help them perform their jobs effectively, decreasing their productivity potential.
- Productivity and efficiency. A workforce lacking the right capabilities or resources will be less productive and efficient, causing lower revenue.
- Technology. Workplaces can streamline and automate processes that employees would otherwise have to do themselves. It can increase the accuracy in those processes and improve revenue.
- Talent. Employee competence in necessary capabilities improves their ability to perform their job and increases the revenue an employee generates.
- Sales and marketing. Organisations need effective market strategies to bring in customers to buy and consume your product or services, revenue for the business.
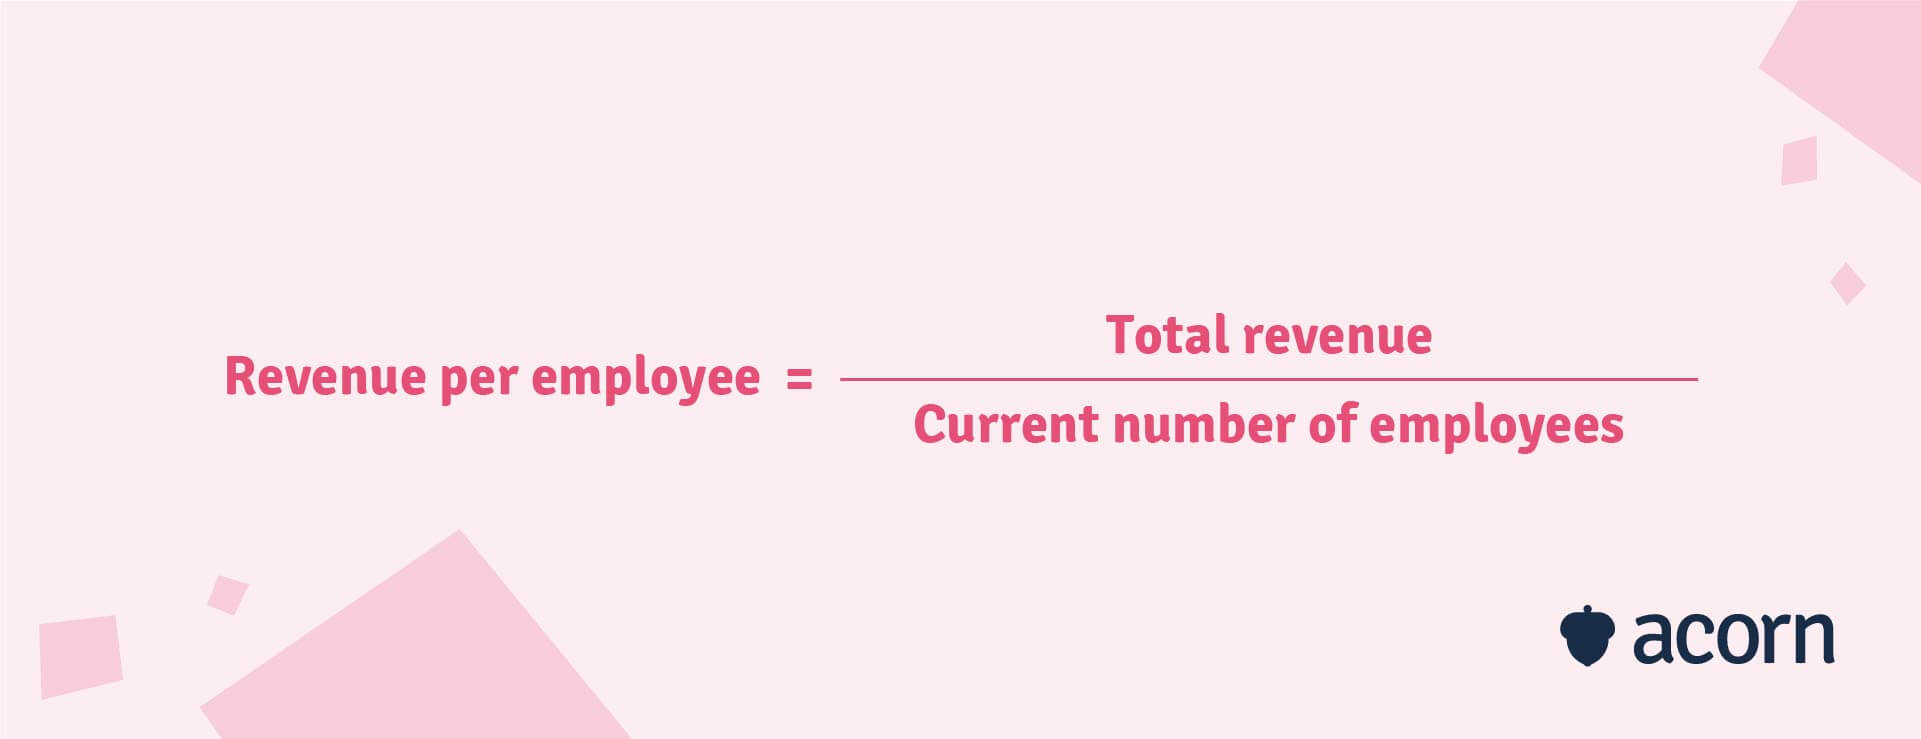
You can calculate revenue per employee by dividing the total revenue your company generated by the current number of employees.
Profit per employee
Profit per employee is an HR metric measuring your company’s net income compared to the size of your workforce. In other words, it calculates the amount of profit each individual employee brings into the business over a certain time period. Its main purpose is to measure how efficiently an organisation utilises its workforce to generate profit.
Don’t confuse this with your revenue per employee. Revenue is the total amount of income a company brings in through its operations, so revenue per employee is about how much revenue each employee generates. Profit, on the other hand, is the income left after expenses and operating costs are accounted for. So, profit per employee is just the amount of net income generated by each employee, rather than revenue as a whole. Think of it as calculating how much your business made back from its products and services, or your return on talent.
You can calculate profit per employee by dividing your net income (that is, the amount left after you’ve accounted for production, labour, and operating expenses) by the total number of employees.
Labour to revenue ratio
The labour to revenue ratio is the amount of money an organisation spends on its employees compared to the amount of revenue generated by the workforce. It shows how much you spent on labour costs to every dollar you generated in revenue. In other words, it’s the return on investment that organisations get from their workers, allowing businesses to see how efficiently they’re operating.
To increase your labour to revenue ratio, you need to make sure you’re investing into your workforce correctly. This means making efforts to:
- Provide training and development
- Streamline and automate processes
- Build employee engagement
- Improve retention
- Monitor and adjust labour costs regularly
- Set and track performance goals
- Identify areas of inefficiency.
To calculate your labour to revenue ratio, you need to know what your total cost of labour is. Everything involved in keeping employees hired at your business is included in that cost.
- Employee wages paid (both salaried and hourly wages)
- Employee benefits
- Overtime costs
- Payroll taxes
- Overhead costs (such as insurance)
- Paid leave
- Employee turnover, recruitment, and hiring costs
- Training costs
- Other benefits and incentives.
Then you just need to divide your total labour costs by your total revenue.
Absence rate
Absence rate, also known as absenteeism rate or absence percentage, is a metric used to measure the rate of unplanned and unexcused absences from work due to sickness or other reasons. It’s used by employers to assess an individual or workforce’s rate of absence from work across a given period of time. Said time period is dependent on outcomes. In our experience, we’ve seen different outcomes for a monthly or annual absenteeism rate formula.
Absenteeism rates can be chronic and intermittent, with chronic absenteeism being frequent, regular and often extended periods of absence, and intermittent absenteeism being only occasional absences.
You can track your employee absence rate with:
- Attendance trackers and time tracking software that can monitor unauthorised breaks and clock-out times (just remember to be transparent about using these).
- Manual tracking. This includes a paper or spreadsheet log of staff absences, usually done by managers and provided to HR.
- HR information systems (HRIS) to keep track of employee non-attendance. The system can be configured to determine absence rates and automatically record absences.
Another way to calculate your absence rate is by dividing the number of total number of unexplained absences by the number of employees in the same time frame, and multiplying by the number of workdays.
Cost of absenteeism
When we talk about the cost of absenteeism, we’re talking about how much it costs a business when employees are absent. We don’t just mean unexplained absences here, because even approved absences affect productivity and, therefore, revenue generation.
- Planned absences include approved leave, such as for personal days or annual, maternity, or paternity leave. These absences are scheduled days, weeks, or even months in advance, allowing organisations to prepare for it.
- Unplanned absences refer to unexpected leave. This can be due to illness, emergencies, other unforeseen circumstances, or some deeper underlying issues.
Planned absences are easier for businesses to manage and ensure that there’s as minimal a hit to productivity as possible, because they’re aware of these absences in advance.
Unplanned absences aren’t always terrible, though. Family emergencies, sick days and medical appointments are legitimate and largely unavoidable reasons for unplanned leave. It’s when unplanned absences happen for reasons like stress or burnout that organisations look into the underlying causes.
The issue is that the cost of absenteeism is hard to track, because the costs to your business don’t just stop at employee salaries and sick leave. There are also “indirect” costs—the intangible expenses to the business as a result of employee absenteeism. So:
- Know your absenteeism rate. This is the percentage of unscheduled absenteeism among employees.
- Track direct costs. This includes wages paid to absent employees, temporary staff and overtime workers as well as any other costs that may have come up as a result of absenteeism (like insurance).
- Determine indirect costs. You can get a rough estimate of indirect costs by multiplying the absenteeism rate by the average revenue per employee per day.
HR to employee ratio
The HR-to-employee ratio is the size of a company’s human resources department in comparison to the total number of employees in the company. In other words, the ratio shows how many full-time HR professionals there are to each full-time worker. Smaller organisations tend to have higher ratios, but bigger organisations usually have lower ratios.
It’s an important metric to calculate to find out whether your HR department is appropriately scaled to your business. Too small or large, and your HR team won’t be able to effectively and efficiently manage the business’s needs.
You can calculate your HR-to-employee ratio by dividing the total number of HR staff by the total number of FTE employees.
Promotion rate
Promotion rate measures the frequency at which employees are promoted within an organisation. Promotions can be internal or external and are usually accompanied by increased pay or job titles. In other words, they’re a form of internal mobility. They can also be vertical, horizontal, or dry.
- Internal promotions involve employees who are already working within the organisation being promoted to a new position.
- External promotions involve external candidates taking on a role in new company higher than their previous position.
Both forms of promotions come in different types:
- Vertical. This is what people typically think of when they think of promotions: Upward movement in a company, with a higher job title, increased pay, and more responsibilities.
- Horizontal (or lateral). This is moving “horizontally” into a new role at the same level, meaning responsibilities remain the same while job titles and pay might change.
- Dry. This involves a new title or role, but without an increase in benefits. This isn’t as common because it can cause resentment and drive turnover, and employees may feel the company is asking more of them for little in return.
Promotion rate can be calculated by dividing the total number of promotions in an organisation in a fiscal year by the total number of employees.
The benefits of technology for HR metrics
Of course, tracking human resources metrics isn’t always easy. With so many HR metrics that can be tracked, it can be overwhelming. There are a number of pitfalls that make tracking the right HR metrics hard.
- Manual reporting is slow and time-consuming. Generating every report manually is not only inefficient but can also drain HR’s capacity to perform other tasks. And because there are so many metrics to track, this can lead you into a never-ending reporting cycle as you try to keep up with regular reporting.
- Reporting requires significant resources. Human resource management is an ongoing, never-ending process, which means it’s time-consuming, drains resources that could be used elsewhere, and requires significant investment.
- Keeping up with new regulations is difficult. It’s easy for businesses to fall behind on the latest HR regulations and standards, especially if your data points are manually collected and analysed.
- You can get bogged down in the details. While looking at everything is useful, it’s not the fastest path to impact. It can be easy to focus on all that extra, irrelevant information that doesn’t really impact the organisation or decision-making from business leaders.
The good news is that these days there’s HR software to help you track your HR metrics. These technologies can help businesses in their human resource management by assisting in data collection and analysis, allowing you to make data-informed decisions. Technologies like an HR metrics dashboard can help you with human capital management.
- Automates data and analysis: HR software can automate the process of collecting and analysing HR metrics, making it both collected and accessible in real-time, saving time and reducing human error. It also means that HR staff can spend the time they would have otherwise spent calculating metrics on other tasks which require more focus. This increases HR teams’ productivity as well.
- Decreases expenses: With fewer mistakes from human error, and significantly less time and resources spent on measuring HR metrics, automated HR and analytics software really helps with lowering costs.
- Improves resource allocation: When you have oversight across all HR metrics, you’re better prepared to make resourcing decisions. This means utilising data to appropriately set resources for hiring, compensation, and scheduling, reducing wastage in the business.
- Improves decision-making: This doesn’t just mean in resource allocation, but in setting efficient recruitment processes and managing human capital. A dashboard can also clearly reveal patterns and trends in your HR data that can show you where your organisation is running efficiently or inefficiently, and help your predictive analytics for the future of the business. Plus, being able to see the data in real-time allows organisations to be proactive about their HR initiatives.
- Integrates with other systems: This allows you to combine HR and business metrics to provide a clearer view of your organisational health, efficiency and performance, and better inform strategic decision-making.
Understanding business impact vs HR metrics
When we talk about business impact, we’re talking about the tangible, measurable outcomes that affect your organisation’s financial performance, reputation, and workforce health. These are not your HR metrics. HR metrics are the different, specific measurements that you use to evaluate the effectiveness of HR strategies and initiatives.
We mentioned earlier that HR metrics don’t tell you the whole story. The main problem is that because they’re mainly focused on the operational human capital, it can’t show you the full picture of the business impact of HR practices. You can’t use them to see or calculate employee’s job satisfaction, engagement, or employee performance metrics.
This is why you need to look to business impact to understand the full effect of your HR practices. That’s where you’ll see the tangible, measurable impacts of HR initiatives on business metrics like turnover and retention, revenue, and workforce health and efficiency. We created the performance learning management system (PLMS) to help with this. A PLMS is designed to codify and operationalise capabilities to improve organisational efficiency, by empowering employees to reach their full potential as impact players in the business. In short: HR metrics give you the actionable insights to create an improved productive workforce that drives business performance.
Key takeaways
HR metrics are useful for measuring the effectiveness of an organisation’s human resource management and how those HR initiatives drive business performance and employee productivity. At their core, they’re about assessing how effective the workforce is at generating revenue and meeting business priorities in comparison with competitors.
It’s important to remember that you can’t just use HR metrics in isolation. You need to measure them alongside one another and other business metrics to understand the full impact of your HR activities on organisational success.
Perhaps most crucially, you need to remember that while HR metrics are important, they aren’t the be-all and end-all of understanding organisational efficiency. They’re just one step in the ongoing process of understanding the business impact of both the HR function and your workforce.
Related Reads on This Topic

Your Guide to the L&D Metrics That Matter for Proving the ROI of Learning
L&D metrics are key to understanding the effectiveness of training initiatives within your business. Explore the different L&D metrics…

How to Measure and Prove ROI in Training & Development
ROI in training is crucial for measuring the business impact of training. We dive into how to calculate it for your training program…

How to Assess, Develop and Strengthen HR Capability in Your Organisation
Get the step-by-step guide on how to create human resources capabilities and implement them in your organisation…