Your Guide to the Essential LMS Reporting and Analytics Tools Every Organisation Needs
As the saying goes, what gets measured gets managed. When it comes to understanding the effectiveness of learning management systems, you need clear insights and you need them, stat. Lacking cognisance of the impact your online training has on your users, overly challenging materials can go, well, unchallenged, struggling learners may feel neglected, and poor engagement will go unmanaged.
There’s a reason why the reporting capabilities of a learning management system (LMS) are often the deciding factor for buyers. Without it, you really have no clear insights into how effective your training strategy is, which in turn means you can’t optimise either the learning experience or your return on investment (ROI).
Still not a believer? We’ve narrowed down the reasons LMS reporting and analytics tools are so crucial to success in this article.
Contents
Why are LMS analytics important?
Learning analytics have the potential to change the corporate training landscape, by optimising the impact of training initiatives, providing the information needed to improve engagement levels and overall performance levels in the workplace. This is driven entirely by the data produced by learners.
Using data gathered from LMS reporting feature and from various learning activities is the only way to ensure metrics are accurate and any resulting actions taken—such as improving the quality of learning resources, onboarding new users to the system or even selecting successors for job roles based on their learning outcomes—will be truly effective. Aligning this data with learning or business objectives is called data-driven decision making, and it’s just about the smartest way you can utilise your LMS in a corporate or eCommerce setting.
Why you should care so much about your learning data
The ends will never justify the means in an eLearning environment, for two reasons.
- You’ll be hard-pressed to ensure learners interact, let alone engage, with a poor environment. Even if it’s a mandatory training, you’ll find the attitude among your cohort is one of ‘do the minimum needed to scrape by’.
- Consider any boring teachers or dry curriculum you’ve suffered through in your life. Did the content make an impact on you? Can you easily recall the minutia of the information you were meant to learn? The critical data your learners create will directly impact the quality of your reporting and analysis.
So, in this sense, it’s a vicious cycle: if your online training is not engaging for any number of reasons, learner data might be overwhelmingly poor. That means the analytics you pull from it and what that means for your organisation will seem dire.
And if you don’t consistently draw that data out using reporting and analytics tools, you won’t understand why your training is falling flat to begin with, and learning initiatives won’t be anywhere near as impactful as you need to be to achieve any learning or business objectives.
The functions you need LMS reporting and analytics for
At heart, an LMS reporting and analytics tool tells you who’s using your system and how they’re using it, based off the data created by learners as they engage with the platform. Any trends or patterns gleaned allow you to determine if an LMS is an efficient and worthwhile investment after all.
Any LMS worth its salt will have reporting that administrators can run over whole cohorts, individuals, and training programs, and some that learners can see to understand their own progress. (More on this later.)
With that in mind, there are a few functions you’ll find reporting and analytics essential for when designing an eLearning initiative.
Assessing engagement
While a somewhat intangible concept to measure, engagement is vital to the success of online training. LMSs with built-in reporting tools work in a two-fold way:
- Extracting data directly from the source; and
- Immediately analysing it for insights on individual and collective learner behaviour, completion rates, enrolments and rate of progression.
Without reporting and analytics, you’ll be unable to glean insights about employees’ learning patterns, engagement or the efficiency of training programs. Those who utilise an LMS for eCommerce—consultancies, for example—will have to spend time looking through and comparing individual results to determine the materials users find most engaging. And even if you could extract this data manually, it’s a time-consuming process rather than an immediate one, considering it requires cross-checking and deliberation.
Real-time reporting
The ultimate objective of any corporate eLearning initiative is to upskill/reskill the workforce and establish an organisation-wide learning culture. Sounds so simple, doesn’t it? In reality, it’s rarely so straightforward a process. With advanced reporting and analytics, admins are able to extract trends through reports, automatically generated in real-time, and then compare those at different stages of the learning process to see learner progress and training impact.
The aforementioned immediacy of reporting and analytic tools feeds into the credibility of most LMSs on the market today. Without real-time metrics, it’s hard to be sure you’re on track with learning objectives, business outcomes and your eventual return on investment—and if you’ve got stakeholders breathing down your neck to ensure their investment is sound and safeguarded, it’s one of the key reporting features to use.
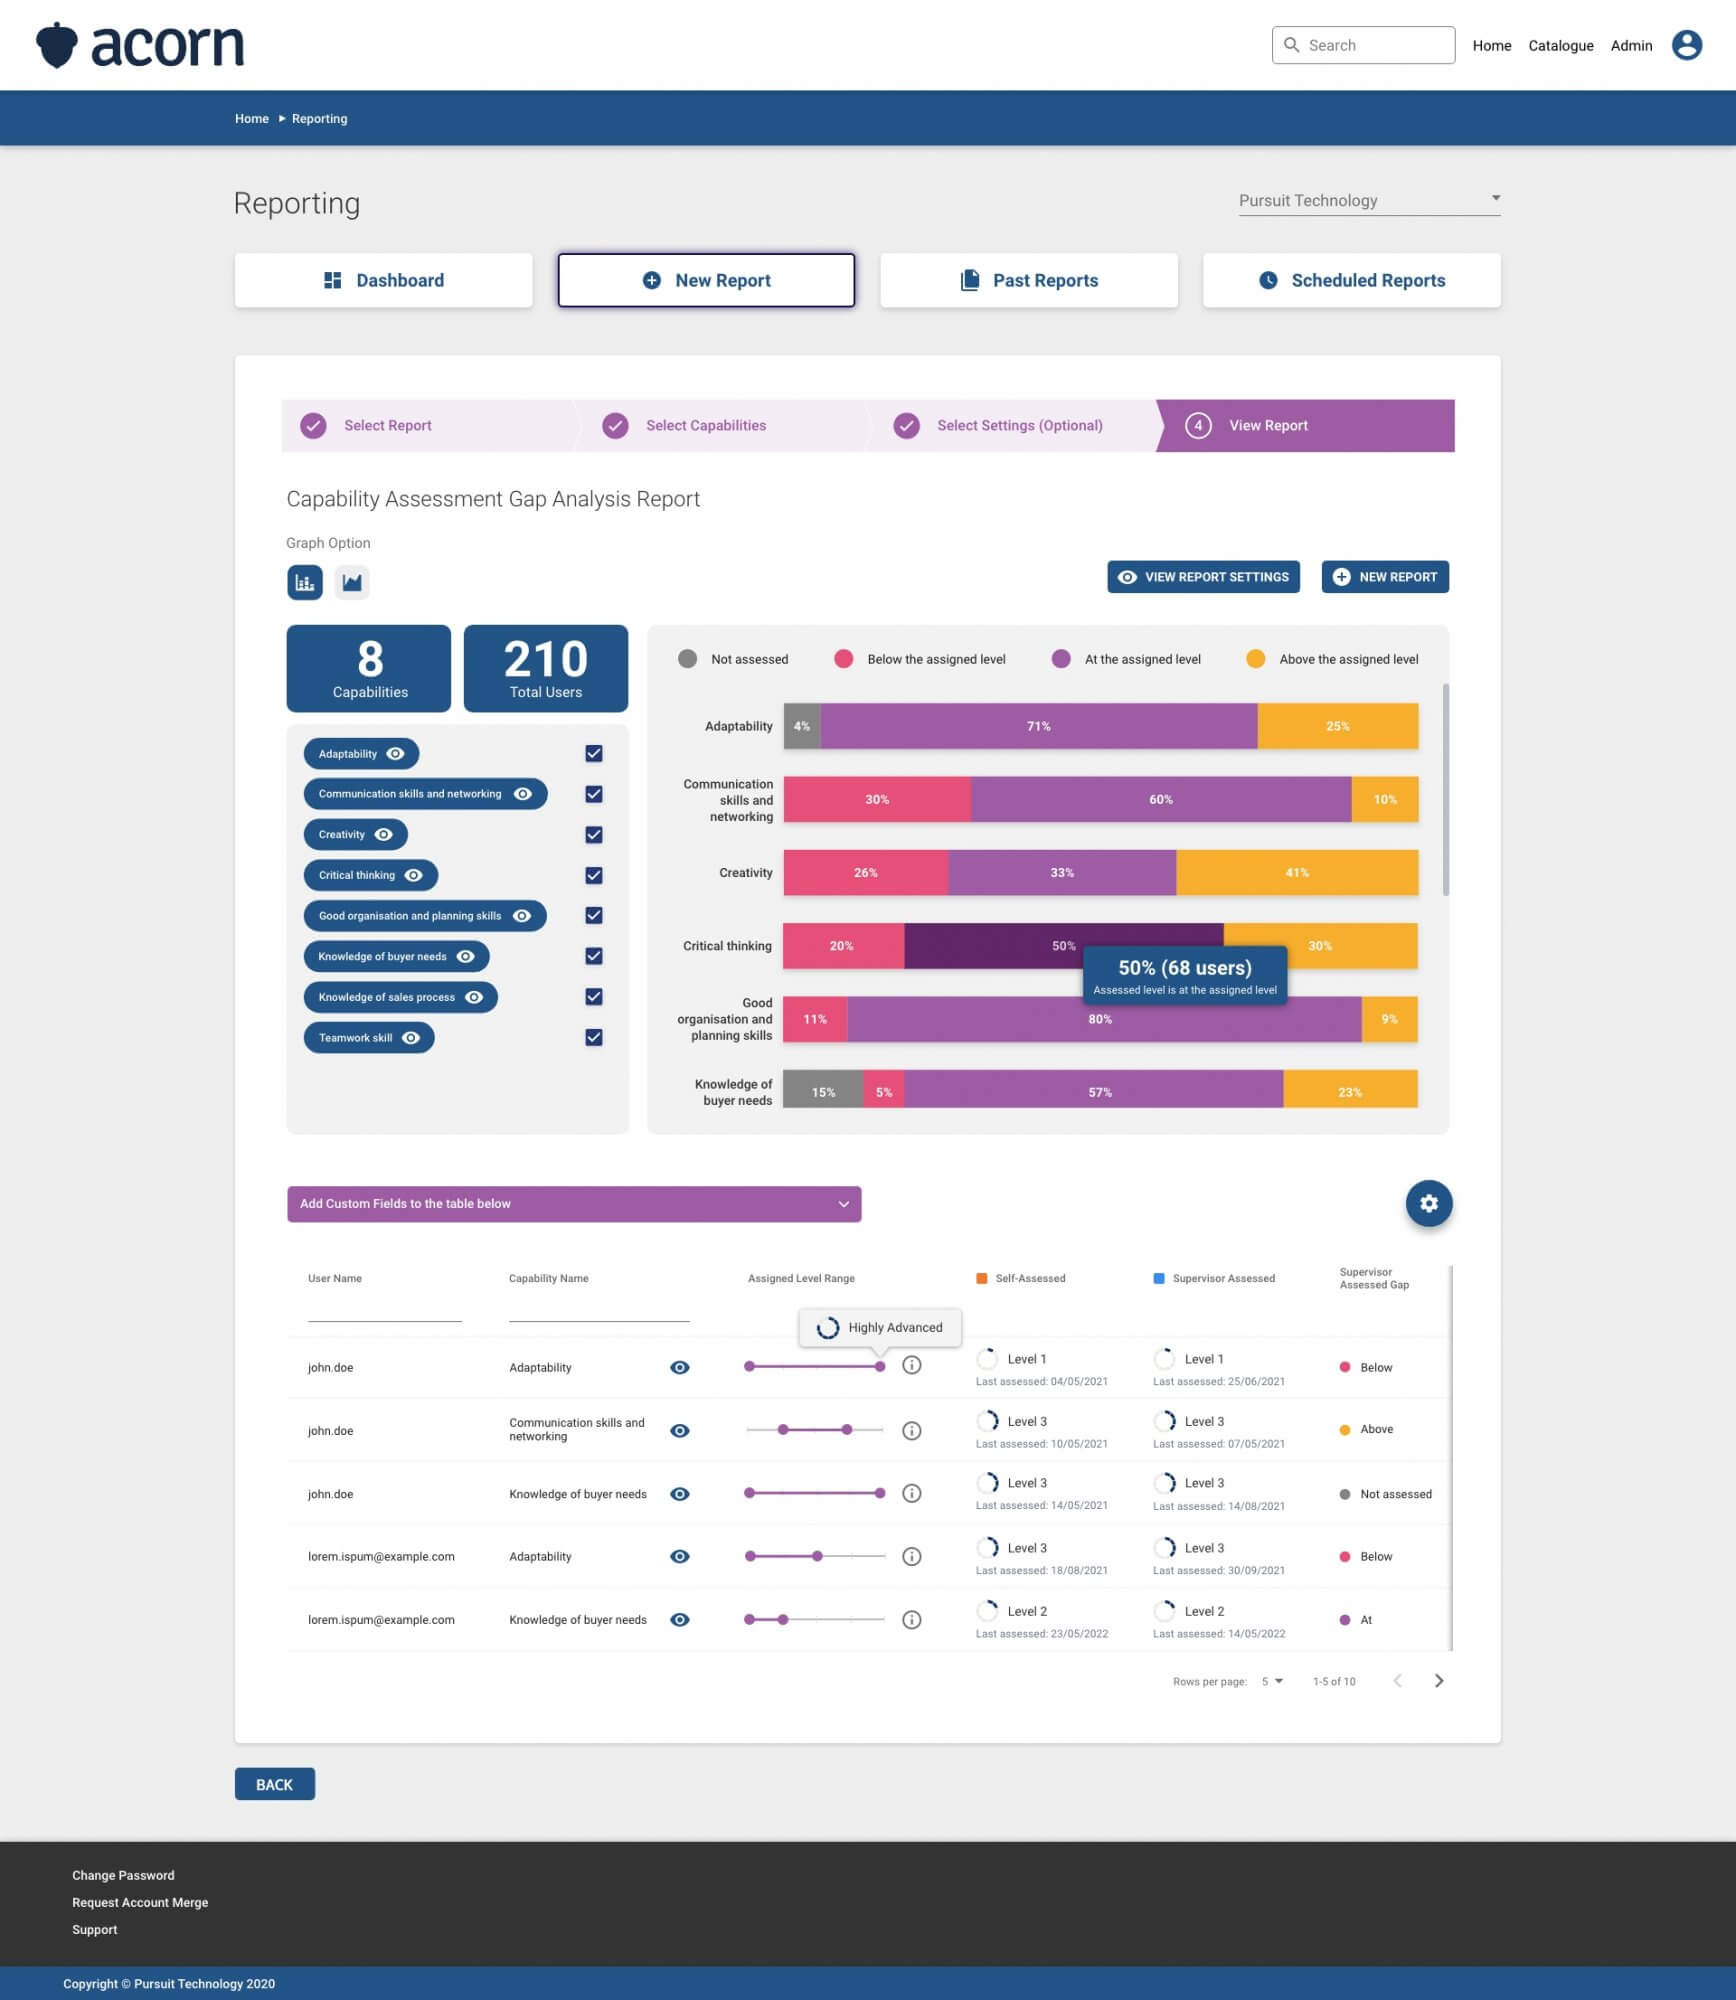
Want to see Acorn PLMS reporting in action?
Hit the book a free demo button here, take seconds to fill in your details, and find out how Acorn can help you succeed.
Analysing cost-effectiveness
ROI is one thing, but cost-effectiveness is a whole other beast when it comes to implementing an eLearning initiative. The sum of all the resources put towards a process, how effectively online training has been utilised and assimilated into an organisation, and whether users are successfully accessing and completing all courses are factors that play into the cost-effectiveness of an LMS. All of which—in case you hadn’t guessed—can be realised through LMS analytics and reporting features.
Using analytics to determine cost-effectiveness needs not be purely a reactive process. Say stakeholders are satisfied with existing behavioural capabilities within their sales department, but a pre-assessment shows competency isn’t where it needs to be.
This allows L&D leaders to allocate resources to those trainings that specifically target sales capabilities, saving the time, hassle and money that would be required if they realised this training was needed after implementation.
Understanding success beyond L&D
For those who offer training to customers or partners (e.g. consultants or contractors), there are other tools that can aid the measurement of success. An LMS integrated with a customer relationship management (CRM) tool is the best tool to track and understand the effectiveness of training delivered through eCommerce. It also helps organisations to understand other important channels, such as sales, marketing and profits, that may be used to measure the ROI of online training.
Then there’s training tied to employee performance. Integrations with HRIS software, or even the right functionality and reports within the LMS will help you draw direct lines of causation between:
- Training and employee engagement or attrition
- Satisfaction and career development
- Existing capabilities and capacity planning.
In this way, LMS reporting isn’t just about figuring out how many courses a learner undertakes or their average course completion rate, but showing the impact of learning effectiveness on organisational strategy.
Types of LMS reports
The full reporting toolkit you’ll want from your LMS should give you a view of patterns and progress across:
- Individuals, to ensure learners are progressing;
- Courses, to ascertain engagement and completion rates; and
- The entire system, to make adjustments for both current and future cohorts.
While most systems will provide a more microscopic view of each broader area (course completions and payments, for example), this is a good jumping off point, particularly when comparing LMS providers.
Individuals
Say, as a system admin, you want to view a learner’s transcript. An individual user report will show work in progress, enrolments, completions, and any badges they may have earned if gamification is enabled. This is a level of reporting learners themselves can also view, and is helpful for them to self-evaluate their own progress and how it aligns with their own learning or career goals. For HRIS-integrated LMSs, this allows for better analysis of those primed for succession, ultimately aiding better workforce planning strategies.
Coursework
Reports on courses, programs or modules give you a sense of who has enrolled in, completed and failed singular coursework. Let’s say there’s a course learners fail continuously. When reviewing learning objectives and initiatives, being able to access data for specific subjects means astute adjustments can be made for future cohorts.
This directly affects your organisation’s bottom line; if the content you’re offering is not engaging, challenging enough or simply too challenging, learners won’t buy in, the system will go unused and stakeholders will be asking questions about why so much time and money was put into an unused system in the first place.
System-wide
Where you can see how an individual is tracking along their learning pathway and how (and if) a group of learners is consuming content, you’ll also want to understand how your cohort engages with the system itself. Everything from how many people have logged into the system in a given timeframe to if users are socially interacting using the platform. Don’t be tempted to think this doesn’t carry the same weight as the analysis drawn from individual and course-related reporting. Failing the knowledge of if your LMS is actually being used, you won’t have a baseline for which to determine ROI, engagement or the overall effectiveness of your online learning objectives.
Key takeaways
Data is king when it comes to eLearning. It’s how you prove ROI and justify resources, show learning transfer, or identify the capability gaps festering and emerging in your workforce.
Ergo, it pays to put LMS reporting analytics at the forefront of your procurement process. Not all systems are made equal, so we recommend looking for an LMS with reports that show:
- Competency levels and capability maturity
- Individual, cohort and workforce assessment
- Timely visual data that can be sent to stakeholders
- Custom depth and breadth of assessment.
The new standard in learning management
Related Reads on This Topic

The Complete Run Down on Comparing LMS Software
The LMS is a complex product. This guide makes it easy to understand and vet.

Proving and Measuring Employee Training ROI
It can be and should be done – before, during and after training. Let us explain.

9 LMS Reporting Tools for Measuring L&D
Proving ROI depends on a little technical analytical support.